Seeing the Big Picture: Redesigning Portfolio Health
Redesigning the account experience to help everyday investors understand their portfolio—and why it matters.
2024 / Athena Advisory


Introduction
As the Lead Designer, I led the design of Athena’s account experience leading to a 39% uptick in our core business goal of managed account adoption.
Impact: $12M increase in AUM within 3 months of rollout
Moving the Needle
“We kicked off by asking, ‘Which dashboard insight will move the needle on managed‑plan conversions?’ That led us to focus on portfolio health and next‑step guidance first.
Outcomes
Because we reframed simplicity as a growth lever, the new dashboard drove a 1.9× lift in account‑insight exploration, a 22% bump in managed‑plan sign‑ups, and laid the foundation for a 30% reduction in front‑end build time. Those results secured buy‑in from two new enterprise partners for Q3.
Designing for Scale
Athena partners with retirement and wealth firms to serve customers below traditional asset thresholds. Our challenge wasn’t just UX—it was how to drive engagement, trust, and conversion for a completely new, B2B2C channel. As Principal Product Designer, I had to balance user needs, business goals, and engineering constraints to shape a product that could scale across partners and portfolios.


Your portfolio, decoded.
Know what you’re missing—and what you could gain.
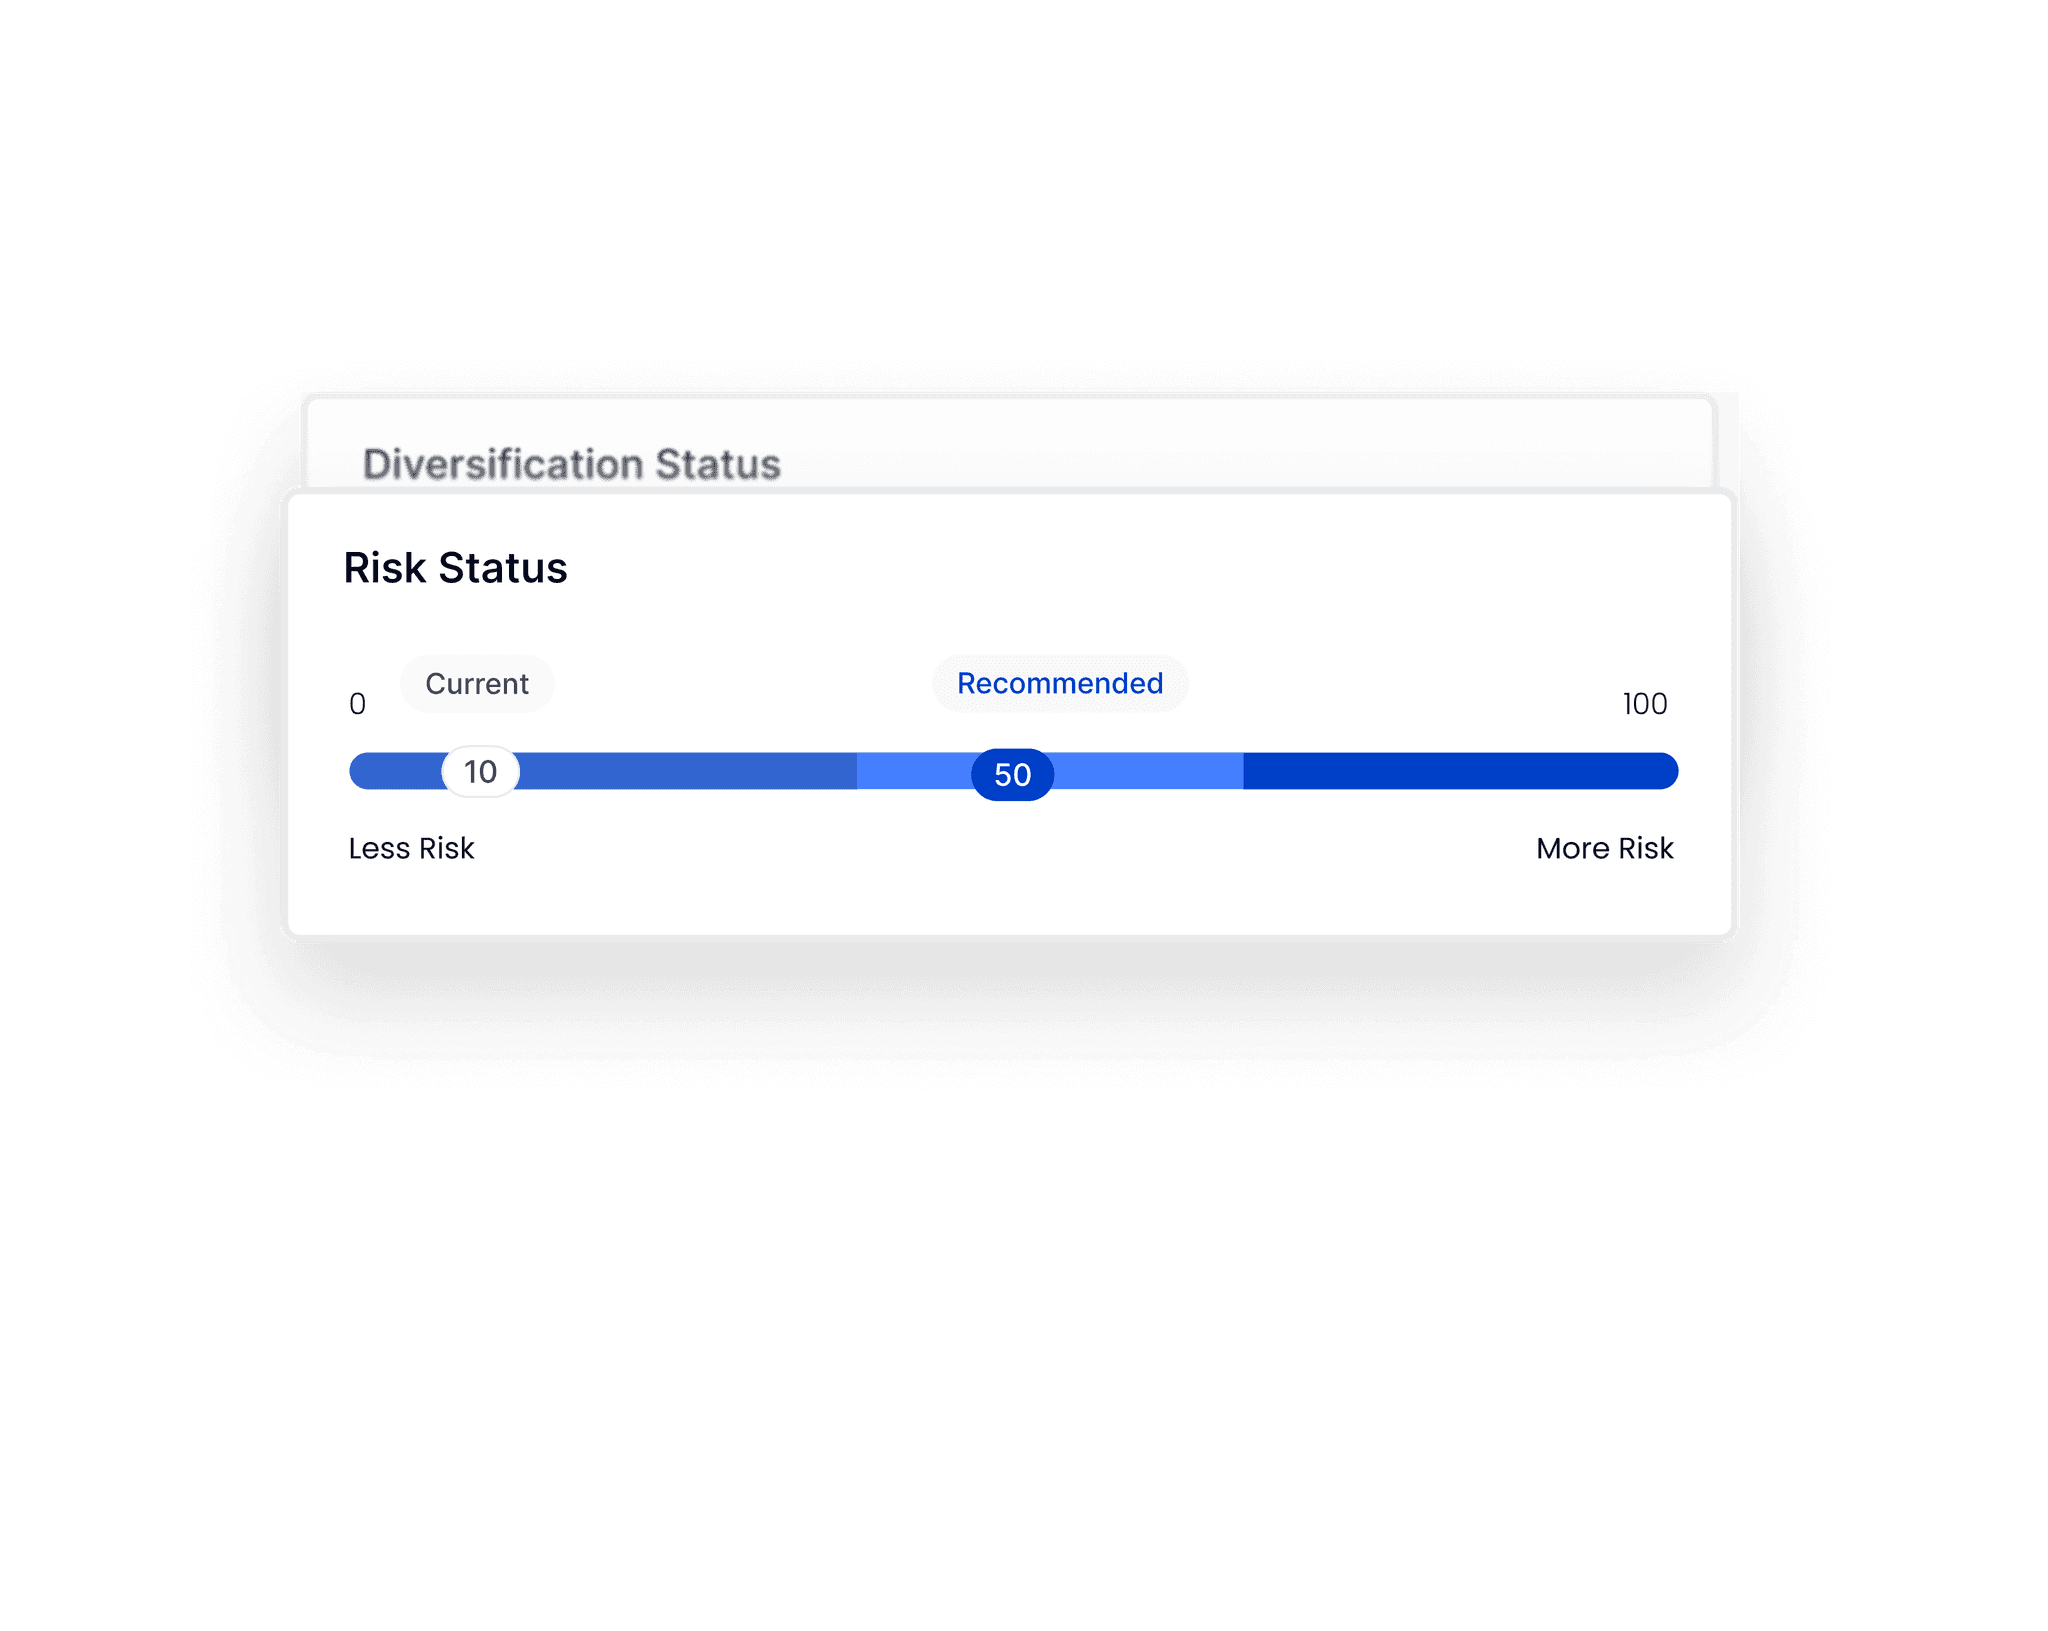
Clear, side-by-side comparisons show how your portfolio stacks up to a professionally managed one
Quickly see where your portfolio stands.
Scorecards for key metrics making it easy to identify strengths and surface areas for improvement
Clarity behind every score.
Personalized recommendations show you what’s working, what’s not, and what to do next.
Impact
$12M
AUM (assets under management) growth within 3 months of launch
39%
more users switched to Managed Plan after using portfolio comparison
02
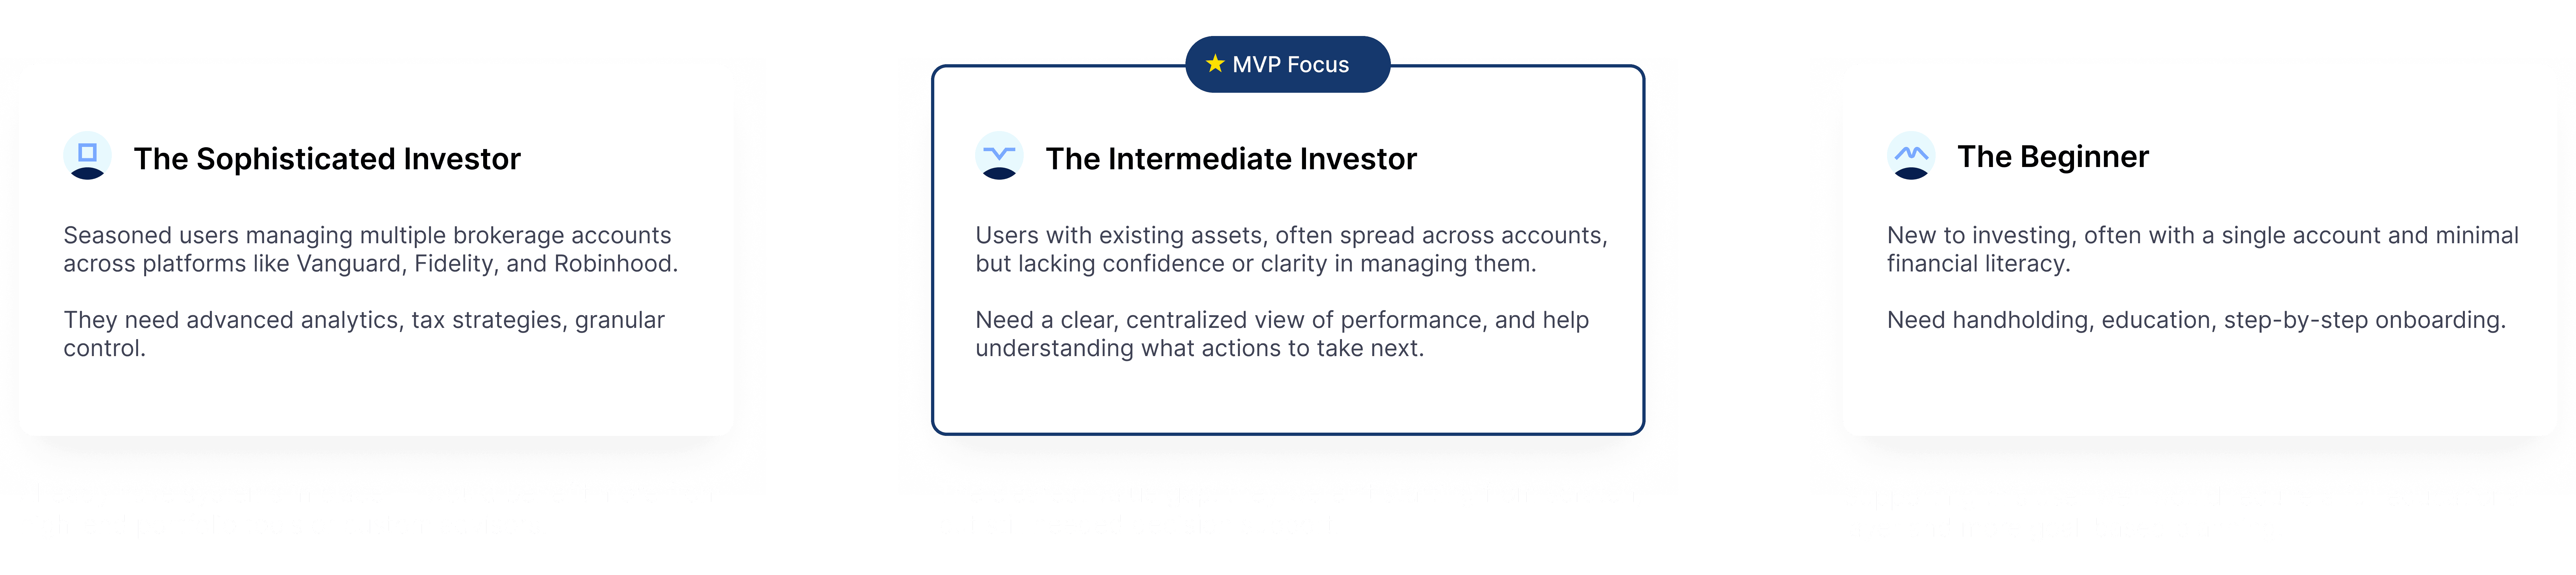
Users
Since users came through our wealth and retirement firm partners, we were designing for a broad base. We prioritized intermediate investors—our highest-impact segment—over designing a generic, one-size-fits-all experience.
Designing for Clarity
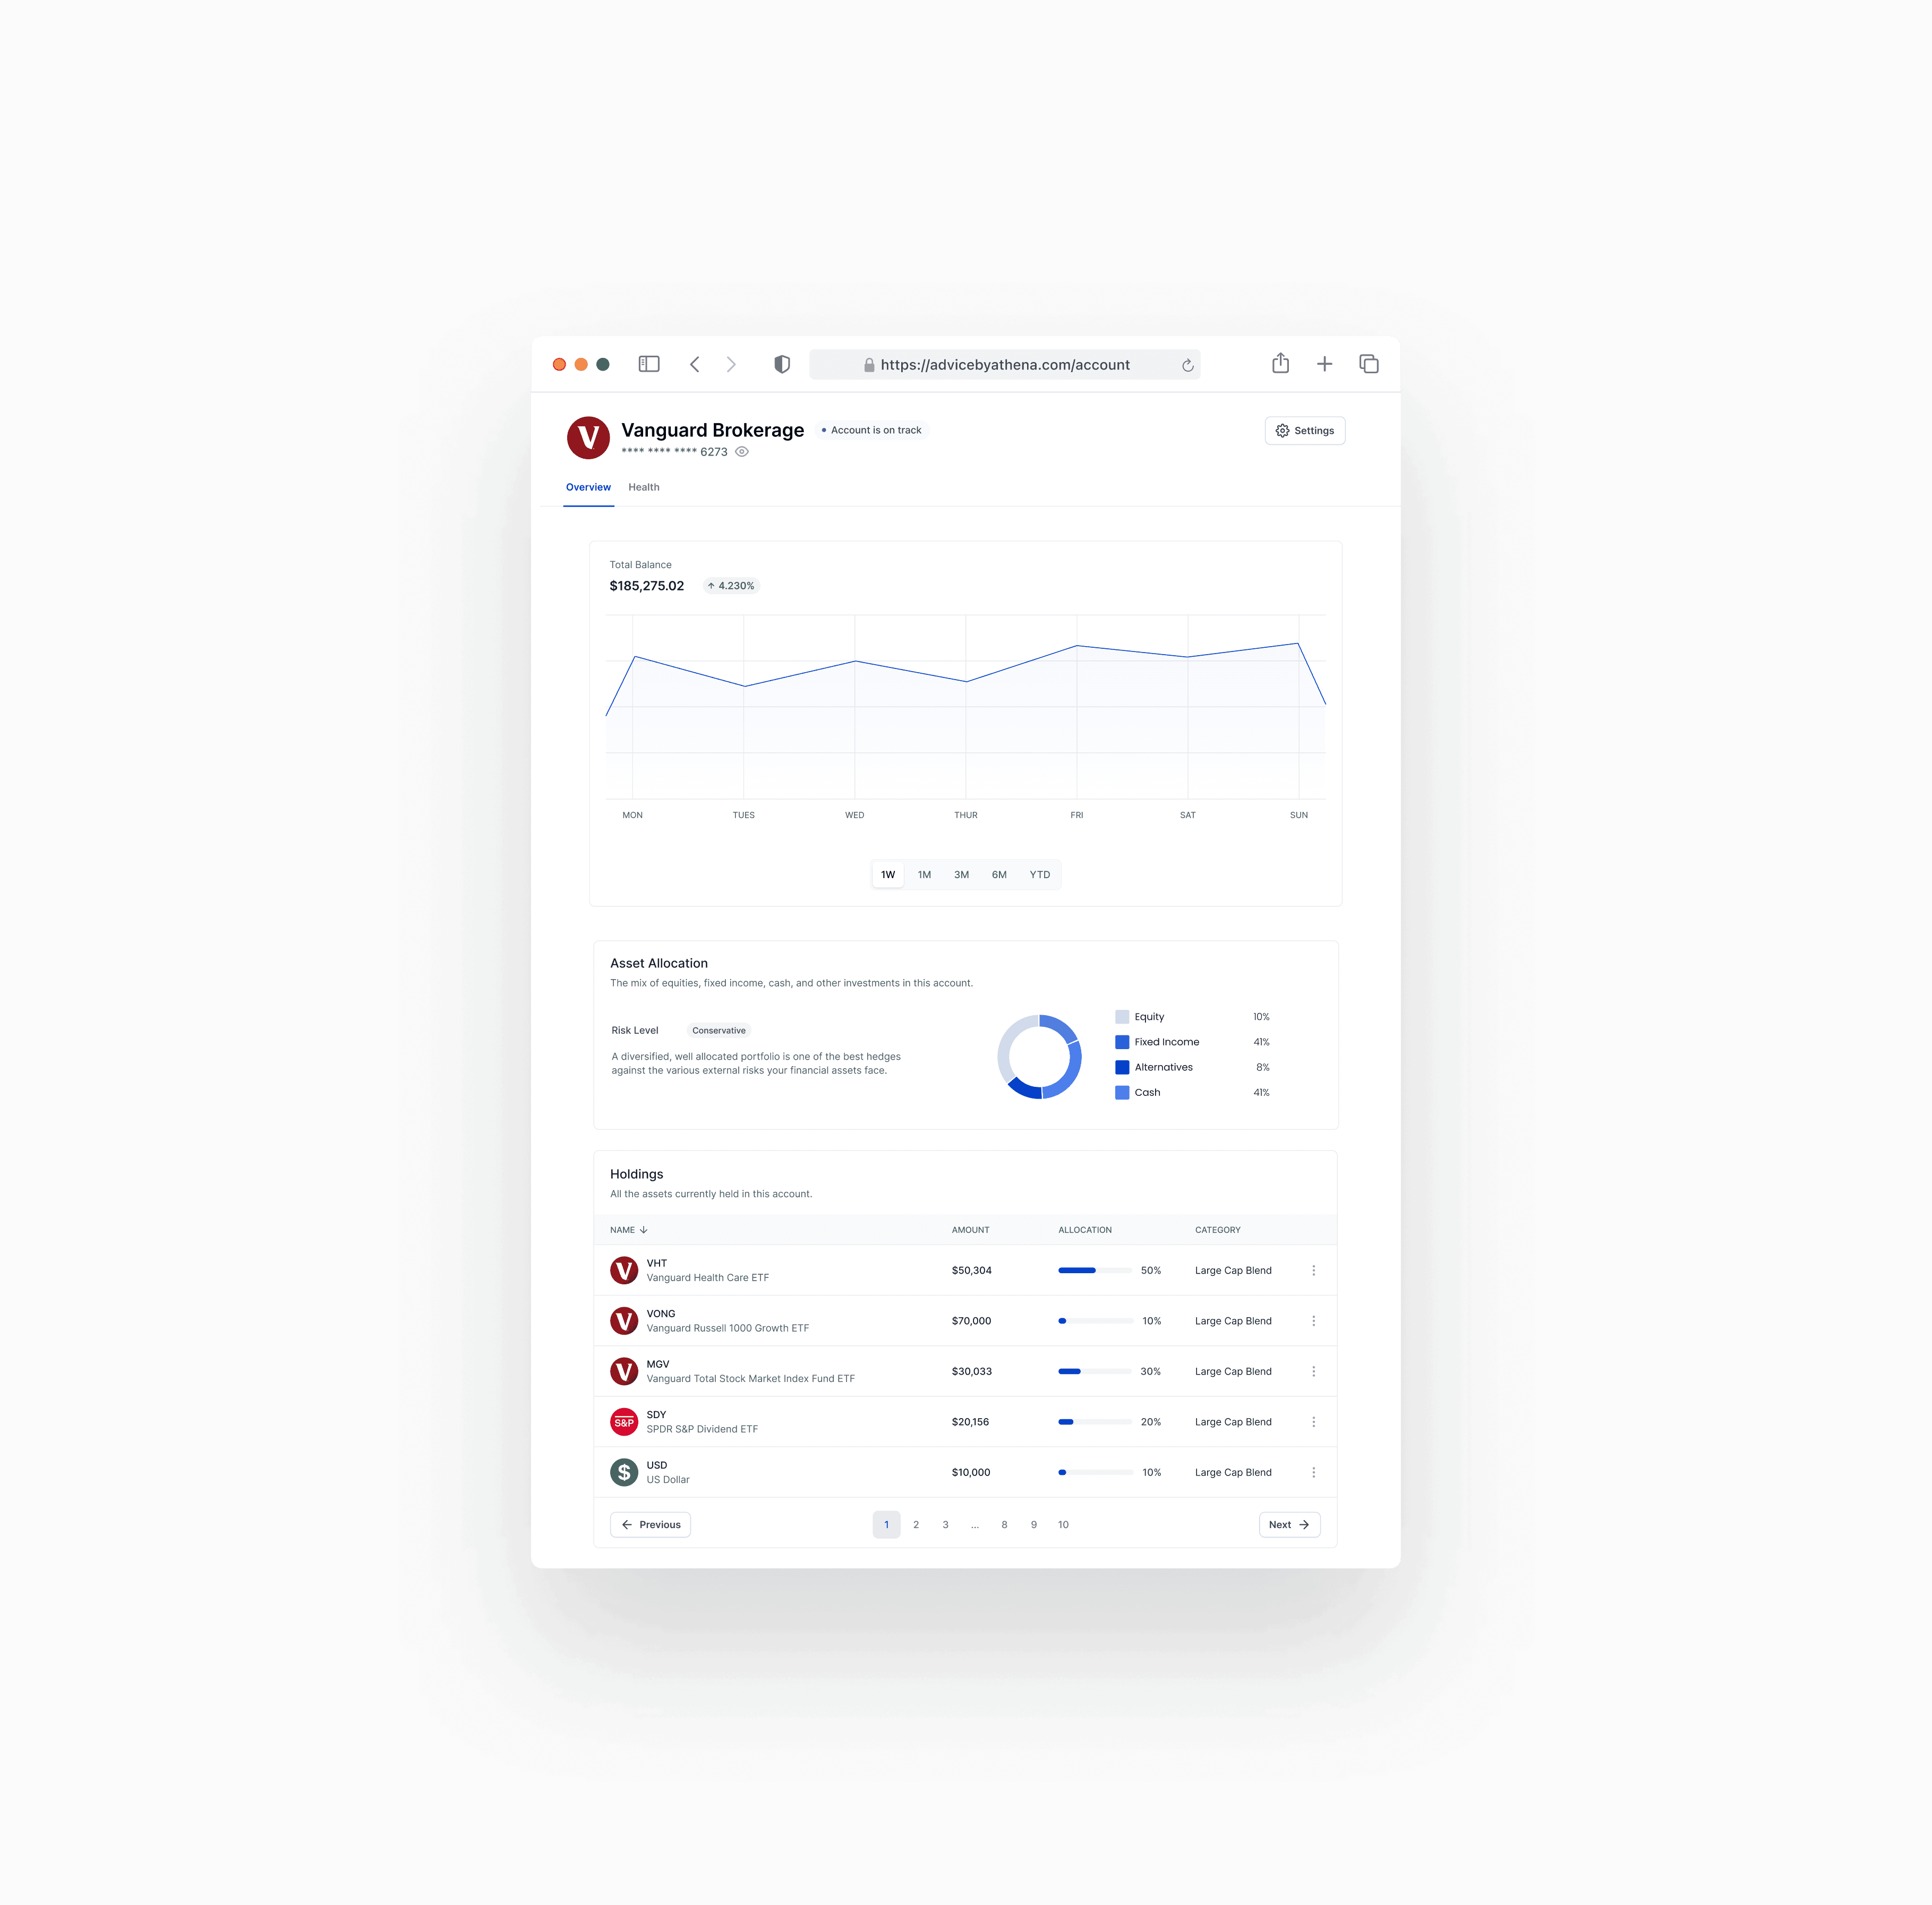
I turned fragmented balance data into a unified health snapshot—categorizing accounts, contextualizing trends, and embedding plain‑English labels—to give users instant clarity and a clear path to action, directly supporting our strategic goals of boosting engagement and enabling scalable growth.
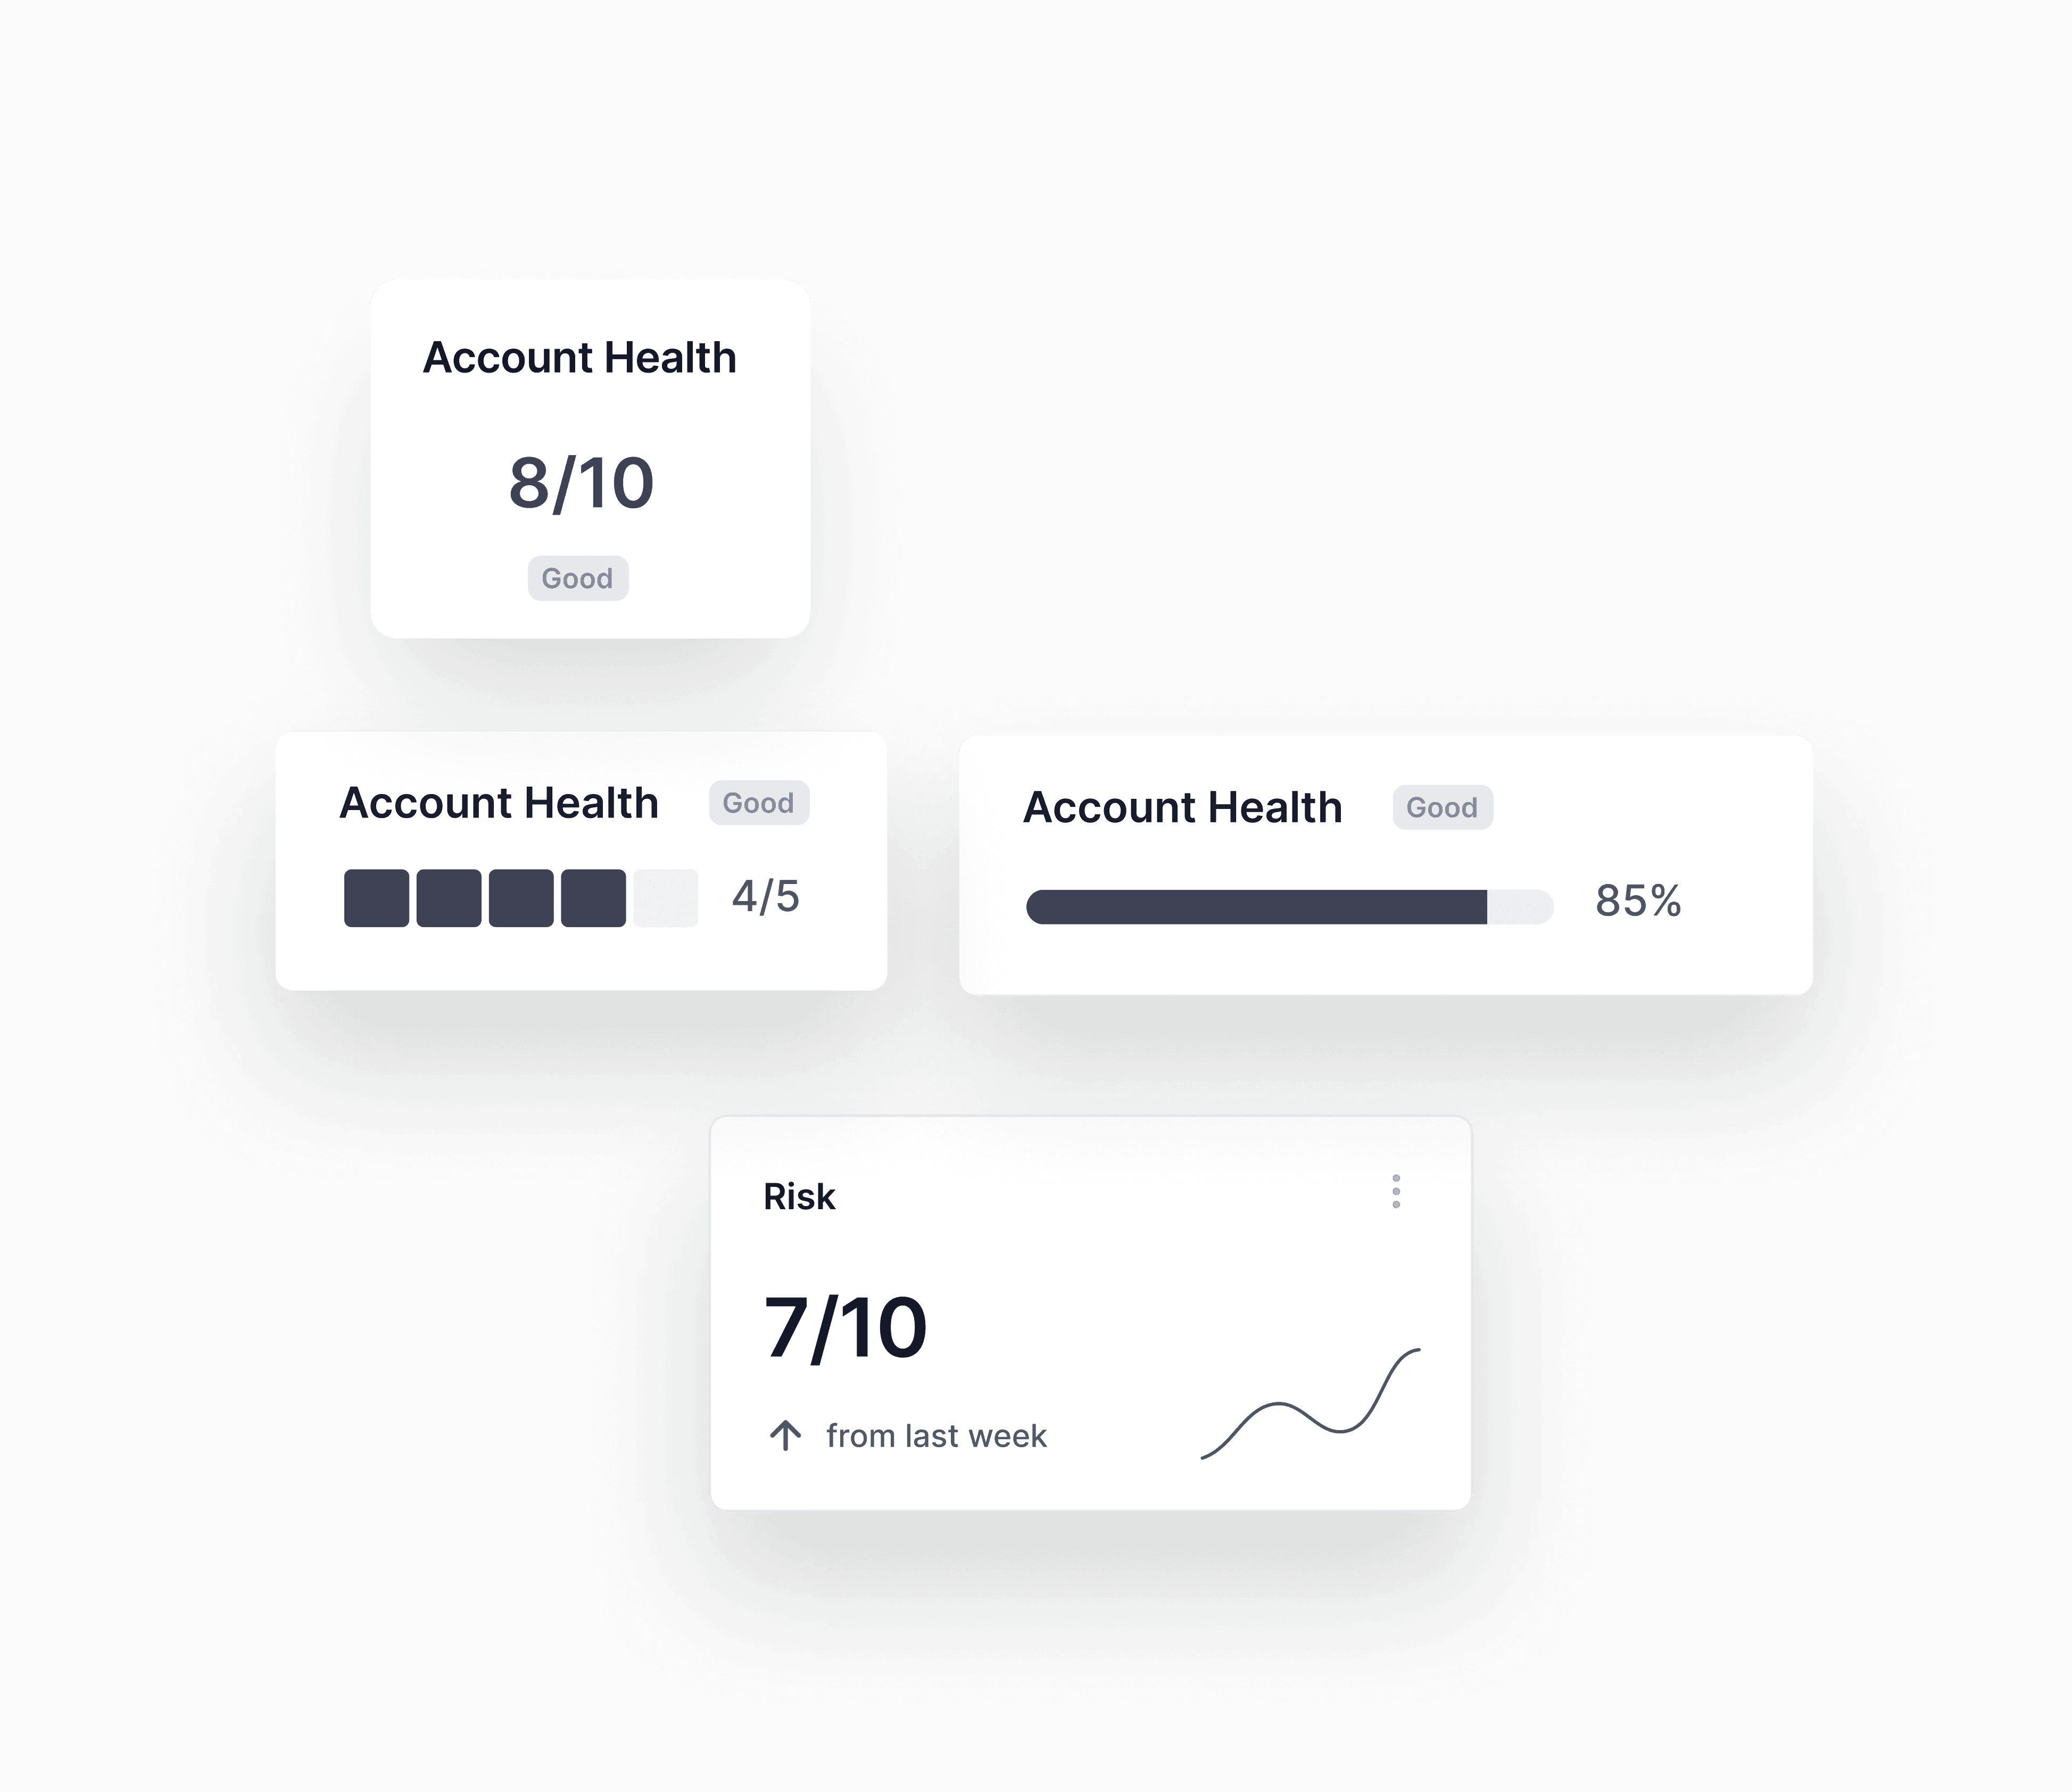
1. Composite Score
A single, combined score summarizing portfolio health.
❌ Too abstract—users didn’t know what it meant or what to fix

2. Grouped Metrics in One Card
Split into three categories but kept together in one dense card.
❌ Hard to scan, difficult to compare, and lacked context.

3. Modular Scorecards
Each metric displayed as its own dedicated, tappable card.
☑️ Easy to compare across accounts
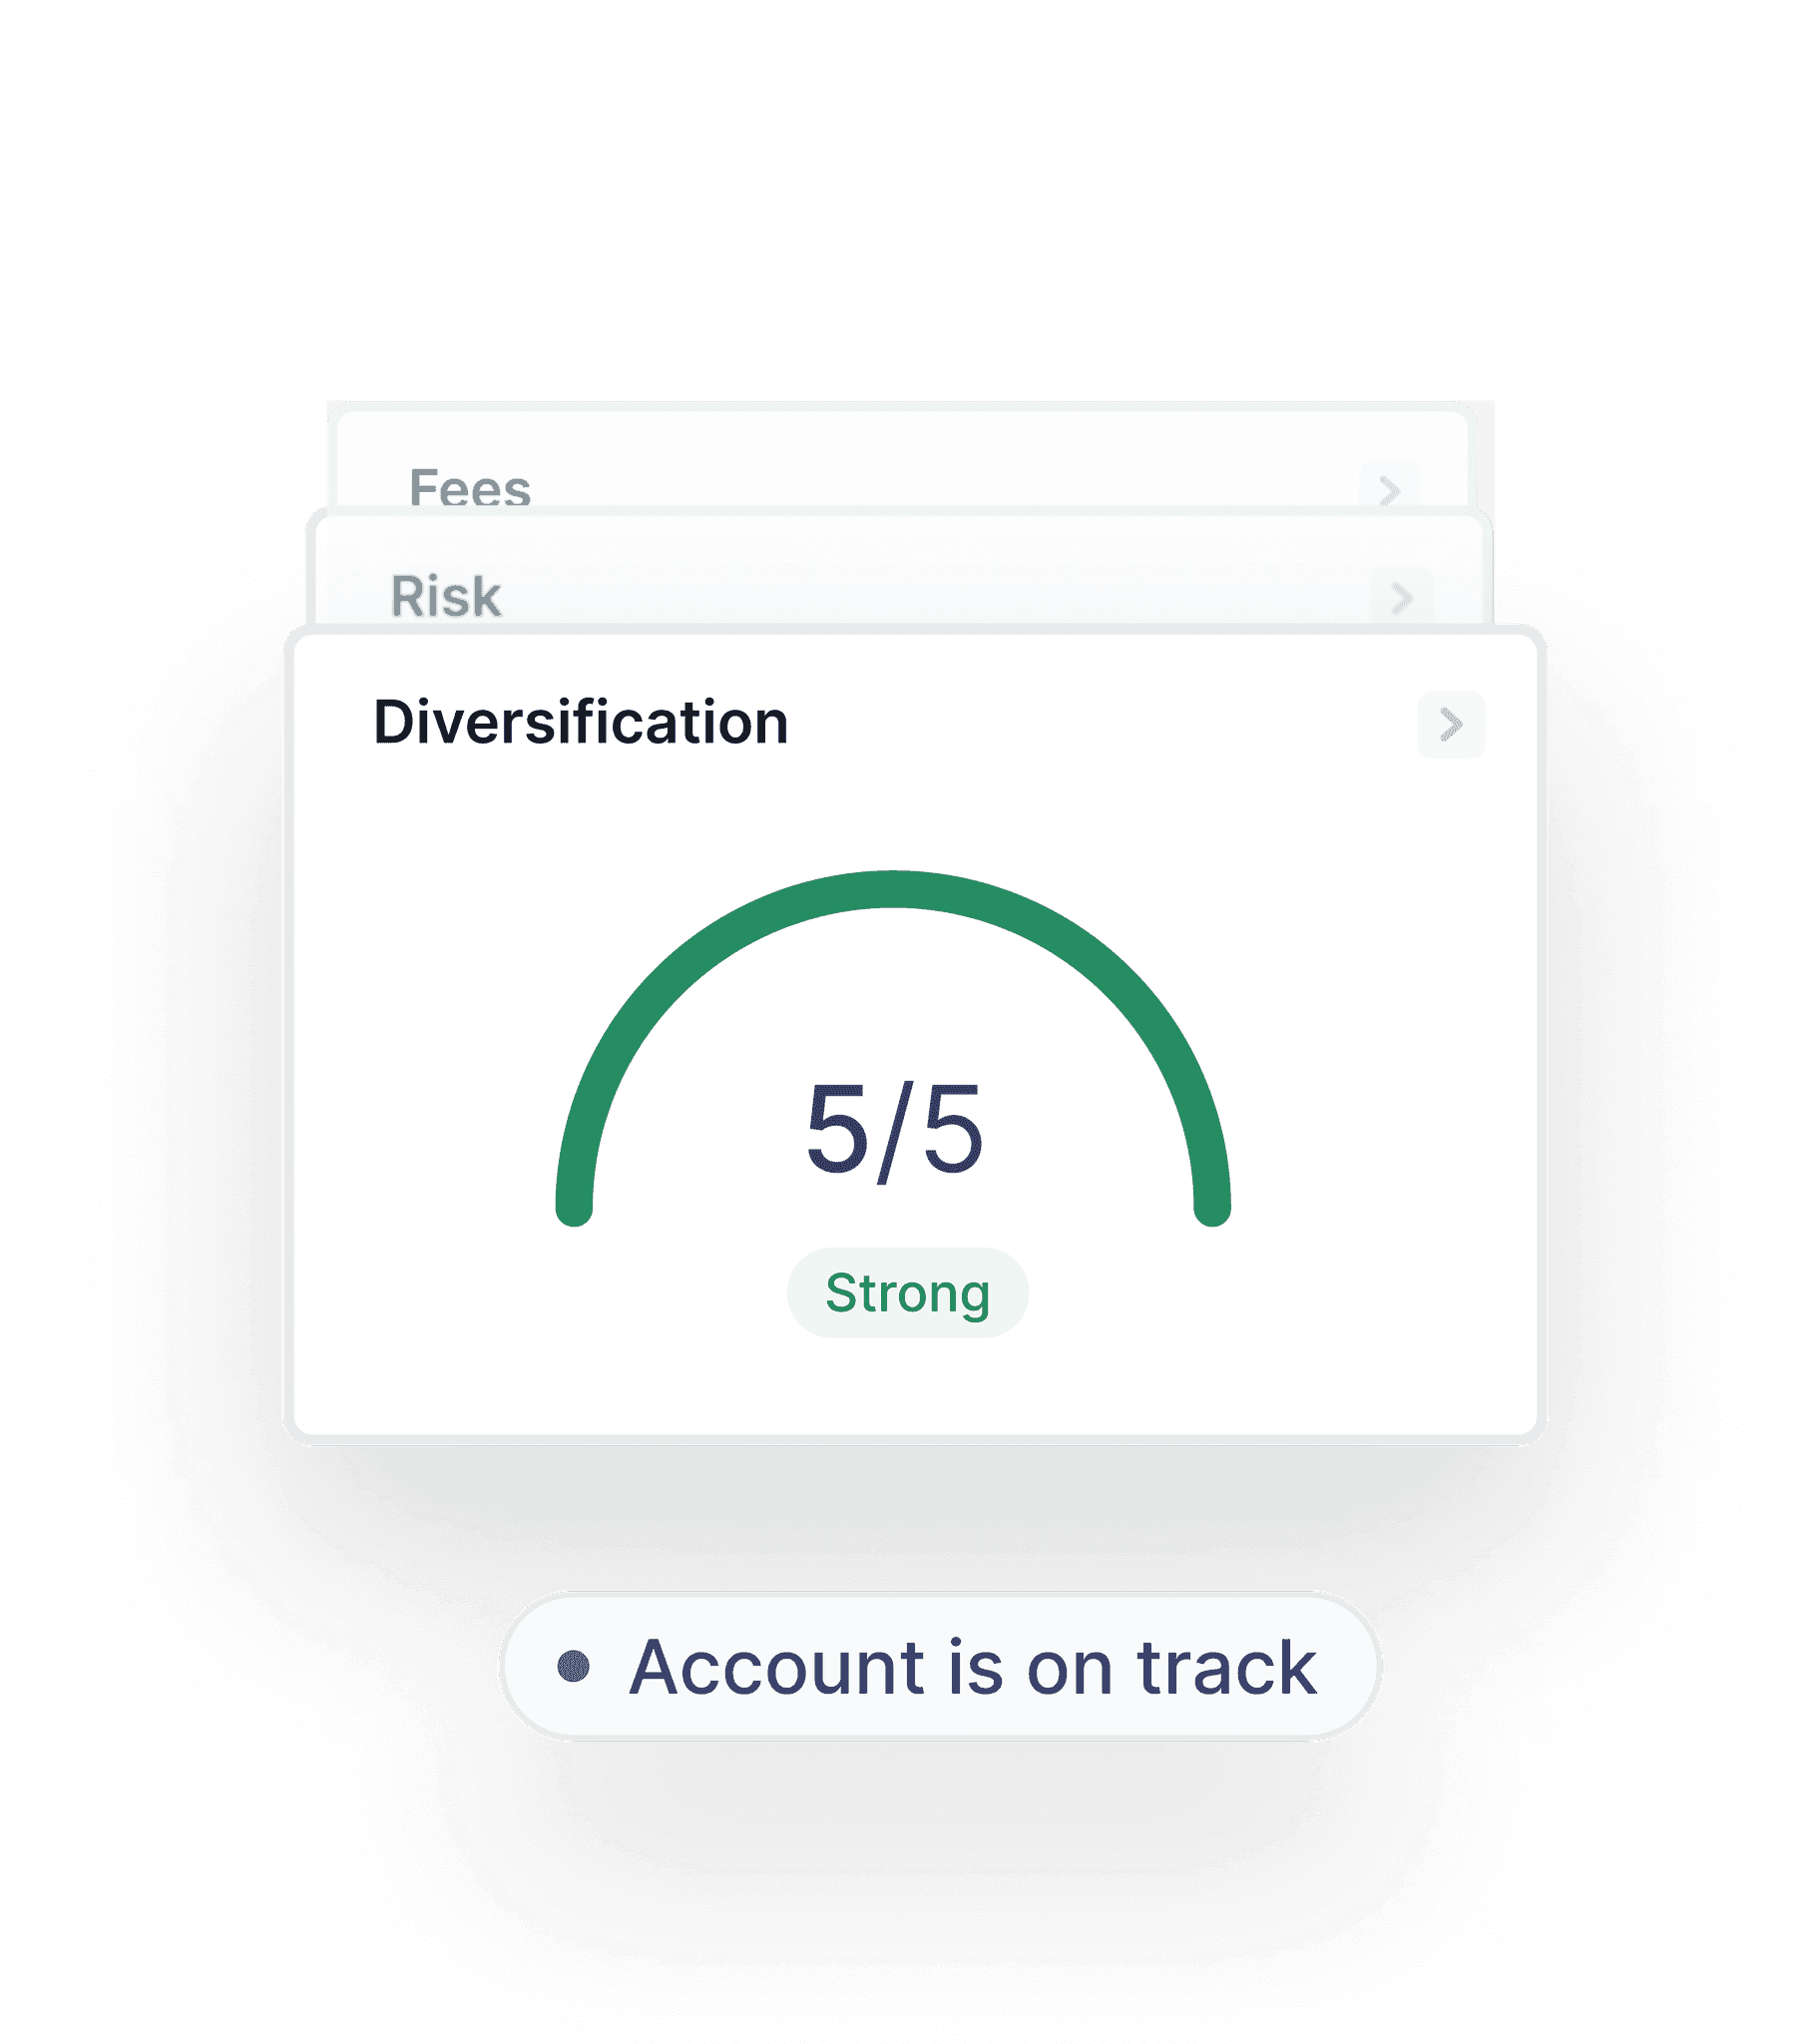
We defined a visual language and consistent card structure for the final health scorecard design. It's quick to scan, approachable for users at any level, and makes it easy to an quickly assess performance across multiple accounts.
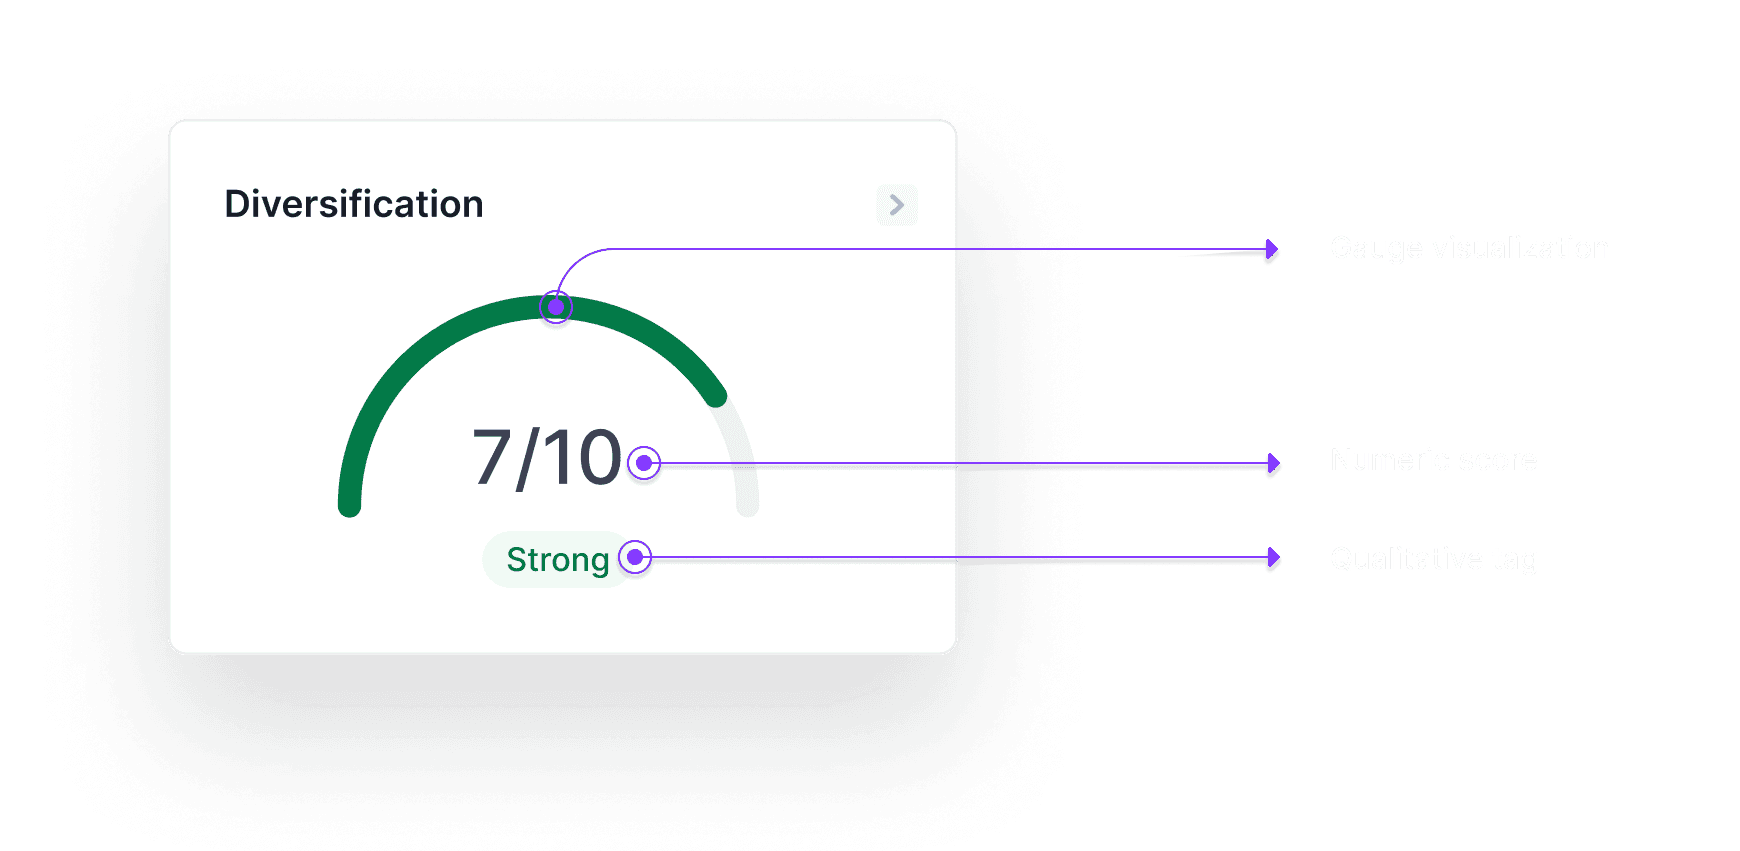
Clear Language

5-Point Gauge

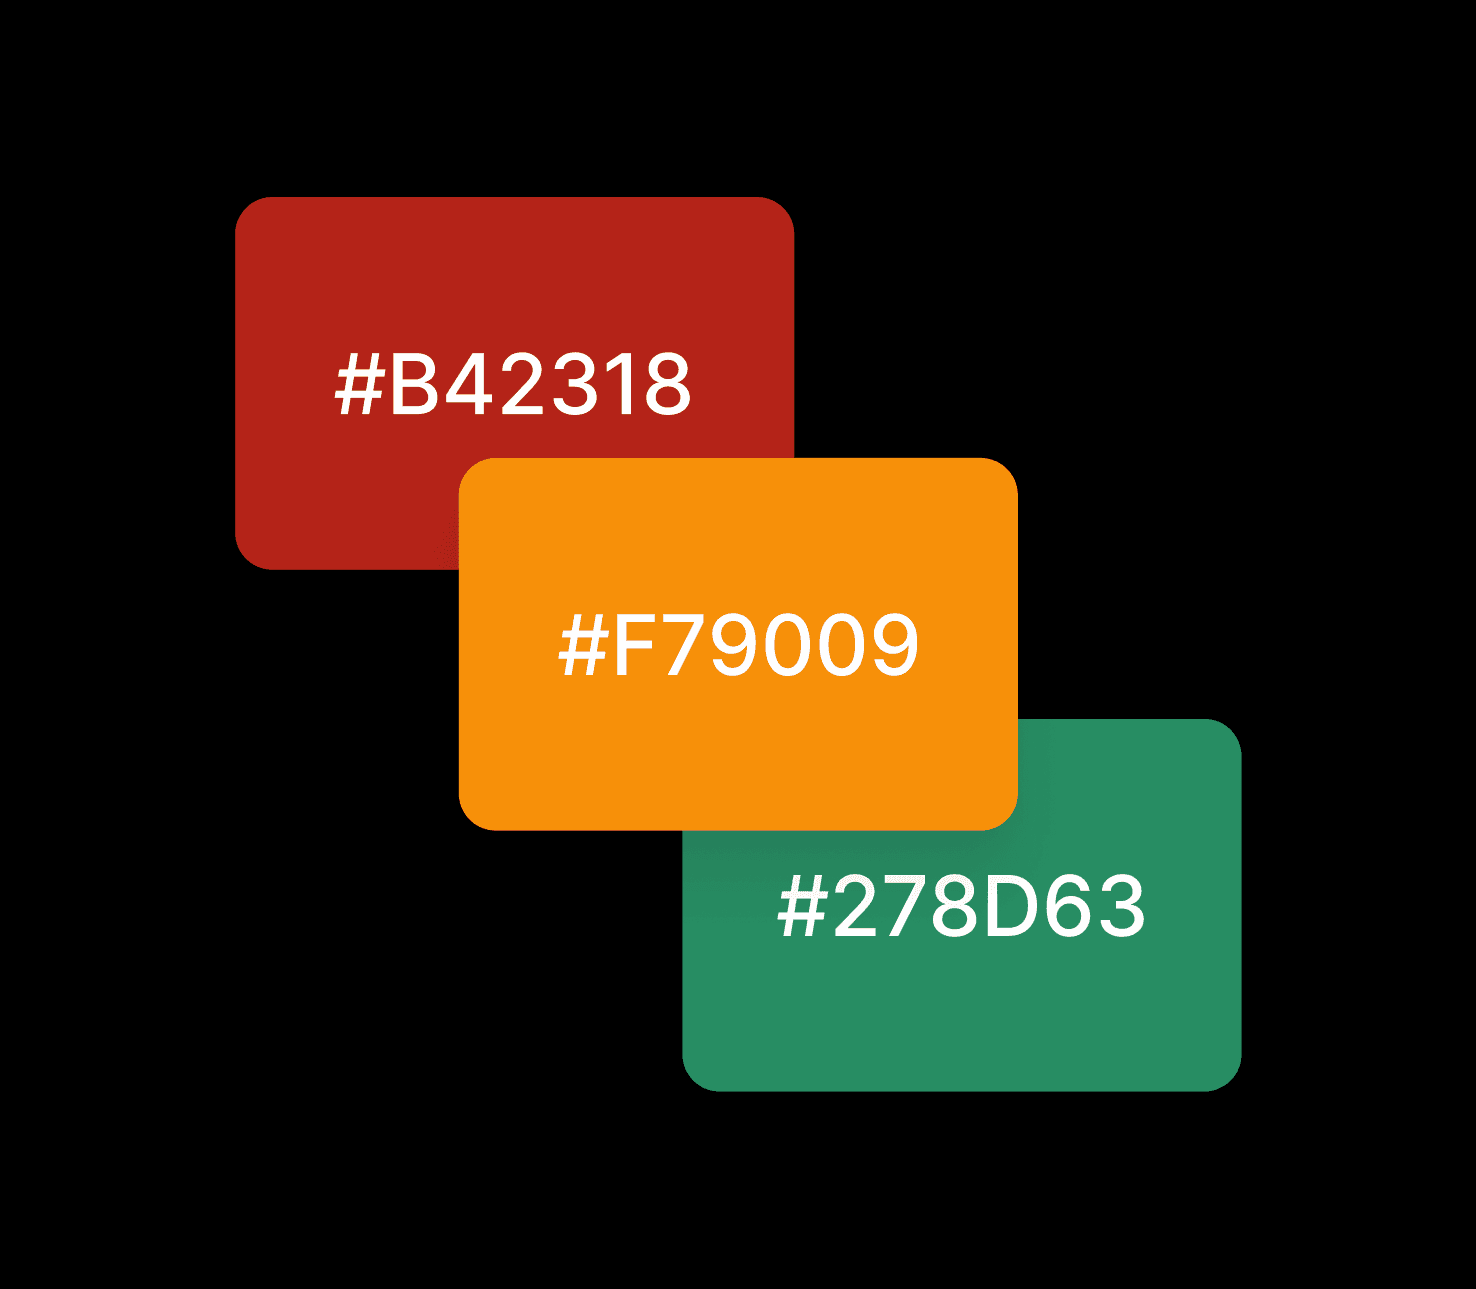
Color Cues
Designing for Action
To bridge the gap between insight and impact, I embedded clear, contextual next‑step recommendations and inline CTAs directly alongside each metric—so users could instantly move from “What’s happening?” to “Here’s what to do next,” driving a measurable 18% lift in guided conversions.

1. In-Line
Displayed recommendations directly beneath each scorecard for immediate visibility.

2. Hybrid
Cards expanded to show insights, with an optional modal for more detail.

3. Modal
Kept scorecards clean and opened recommendations in dedicated modals.
Prototyping
& Testing
Over the course of one week, I ran six remote, moderated sessions with active Athena users using our prototypes.

KEY INSIGHT
Modal Layout emerged as the clear winner. It maintained a clean, scannable layout and encouraged focused, meaningful engagement. The Hybrid Layout mixed interaction patterns confused users and the In-Line Layout felt cluttered and made it hard to parse multiple insights at once.
Final Design
Our final design surfaces tailored guidance in modals so users can dive into specific insights without distraction. It aligns with our goal of helping users make meaningful, focused decisions without cluttering the core experience.


Challenge 3
Designing for Business Goals
Problem
The benefits of switching to a managed account were buried and abstract. Users needed to see tangible, personalized reasons to justify the switch—without feeling pressured.
Research Insight
"Why would I pay for a managed plan? What’s in it for me?”
How Might We
How might we clearly show the value of switching to a managed account?
Final Designs
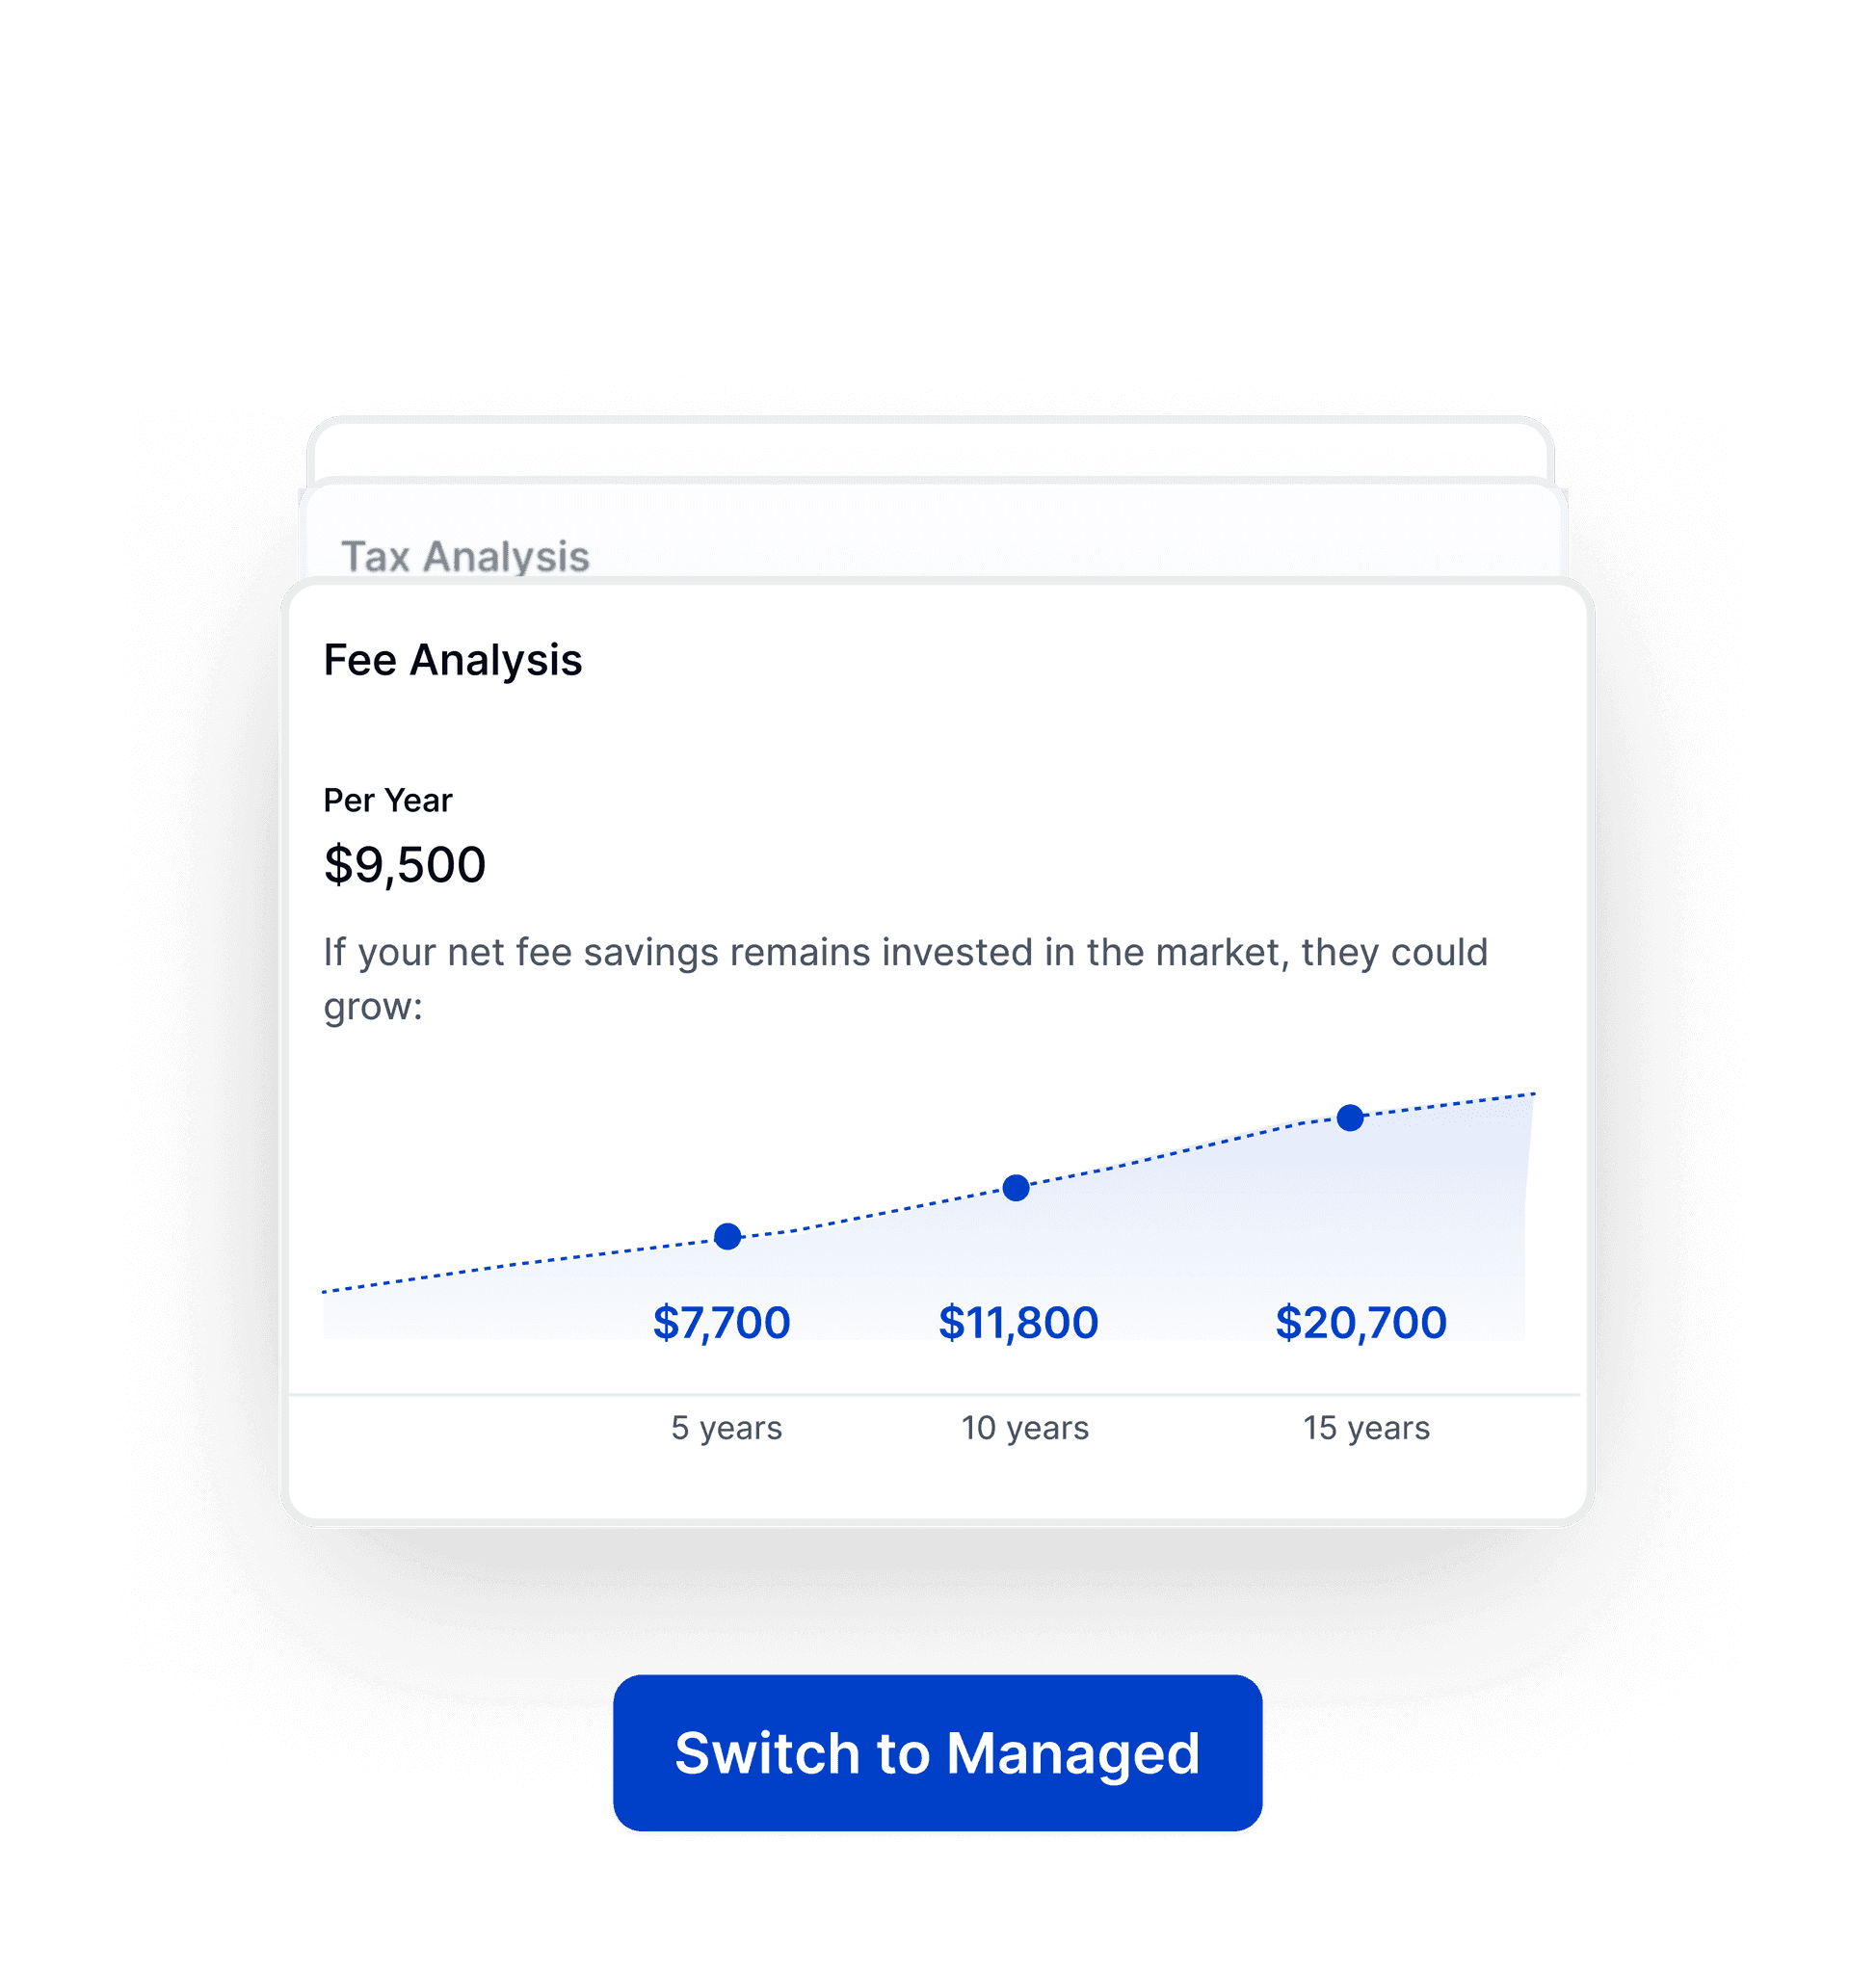
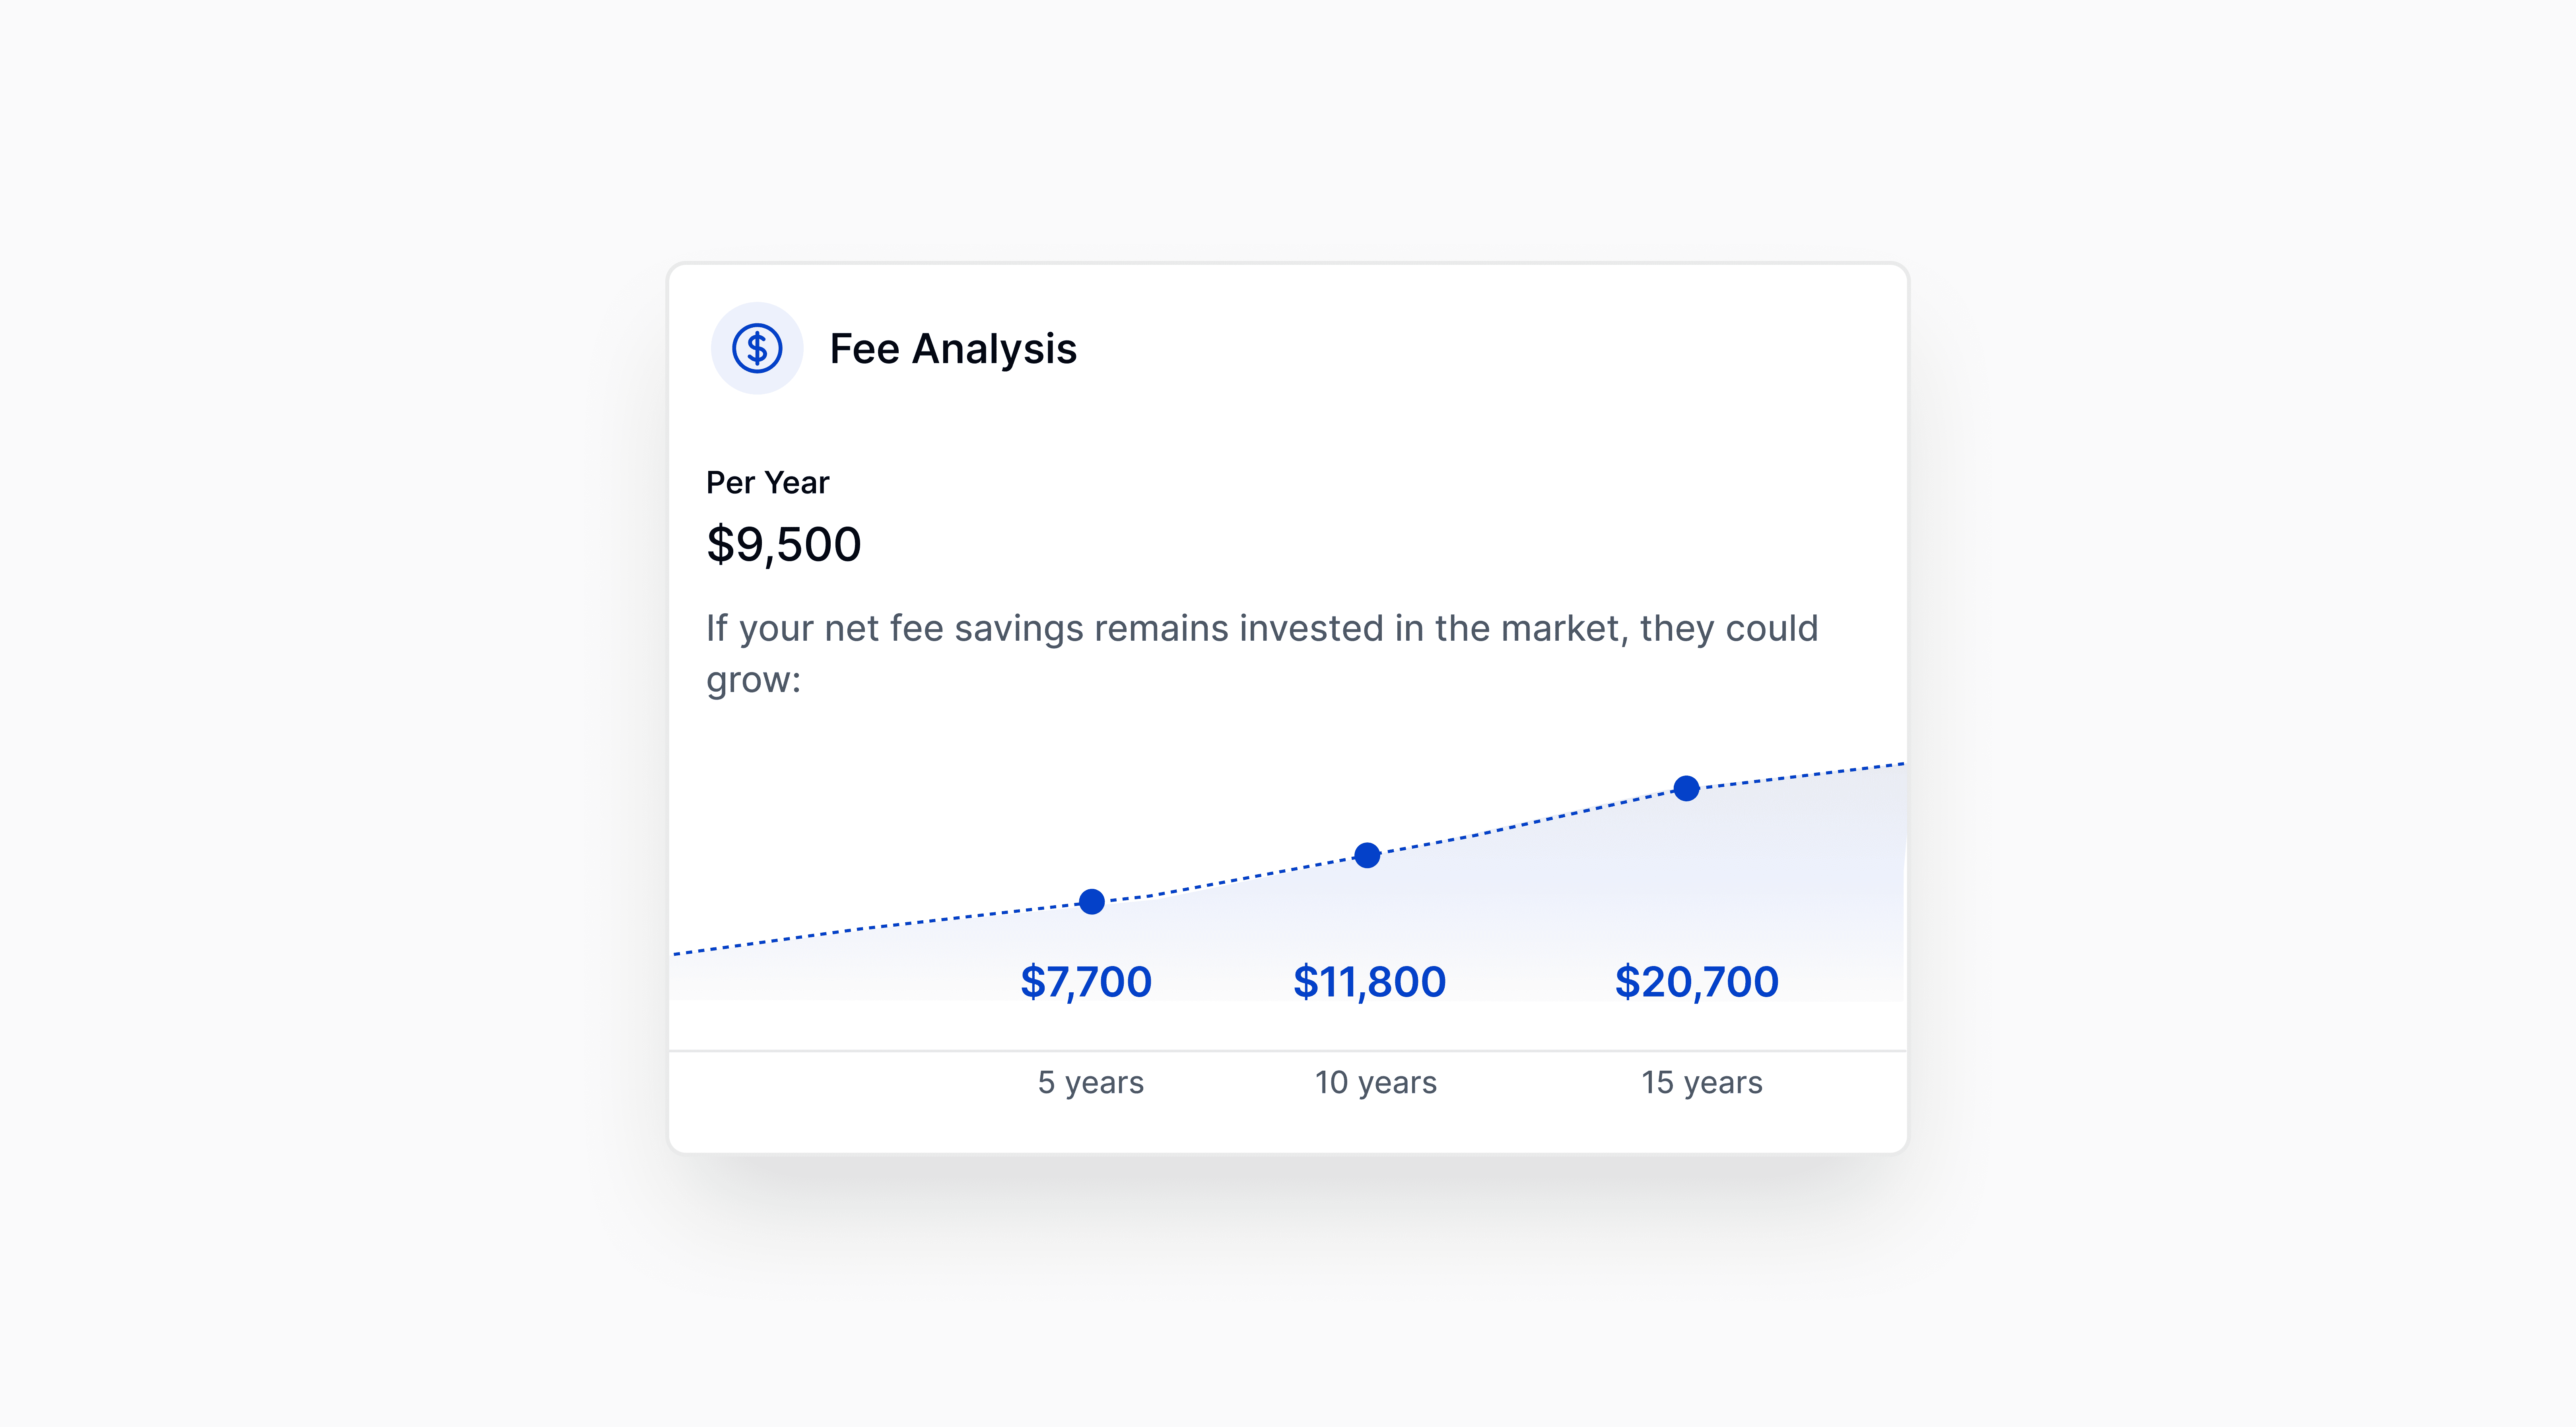
I designed a dedicated Managed Account Benefits section. This framed the opportunity cost of inaction by surfacing high-impact but often-overlooked advantages.
Each card highlighted a specific benefit with personalized, data-backed context. By quantifying these “intangible” perks, we helped users see not just what they were missing, but what they could gain.


07
Collaboration
I worked closely with engineering and data to validate what was feasible in the MVP timeline while still meeting user needs. I also aligned stakeholders across product and partner success teams on prioritizing intermediate users—a strategic decision that balanced business impact and user value.

Results
30%
faster feature delivery
40%
fewer UI bugs in production


1. Data-first
Prioritized raw visibility with inline tables and filters.
1. Data-first
Prioritized raw visibility with inline tables and filters.


Reflections
Composite metrics are easy to scan—but hard to trust.
We initially explored using a single score to represent account health. While it looked clean, users felt confused and judged, not informed. This taught me that even the most elegant data display falls short if users don’t understand what’s driving it or how to act on it.
Designing for B2B2C sometimes means designing without context
Because our users were coming through enterprise partners, they often had no onboarding, no prior knowledge of Athena, and no idea what they were looking at. This forced us to make every interaction self-explanatory, every layout intuitive, and every insight feel relevant since we could not expect brand trust or training.Constraints shape clarity
Tight MVP timelines, inherited UI patterns, and unclear product-market fit meant we couldn’t rely on ideal conditions. Instead, we treated each constraint as a forcing function to focus on the highest-leverage problems. By embracing the reality of v1, we were able to ship a focused experience that laid the groundwork for deeper portfolio insights down the line.
Feedback
"It finally felt like I had a command center for my accounts—not just a bunch of charts."
Athena User
"This dashboard finally gives our clients clarity without overwhelming them. It’s streamlined, but still powerful."
Financial Wellness Officer
“I used to bounce between screens to find where my IRA was hiding—now that's a thing of the past!"
Athena User
"When the allocation donut immediately showed I was 85% in equities, I rebalanced straight away—something I’d never have spotted so quickly before.”
Athena User